Report on the global bio-based polymer market 2022 – A deep and comprehensive insight into this dynamically growing market
The year 2022 was a promising year for bio-based polymers: Bio-based epoxy resin production is on the rise, PTT regained attractiveness after several years of constant capacities and PE and PP made from bio-based naphtha are being further established with growing volumes. Increased capacities for PLA are ongoing, after being sold out in 2019. Current and future expansions for bio-based polyamides as well as PHAs are on the horizon. And also, bio-based PET is getting back in the game.
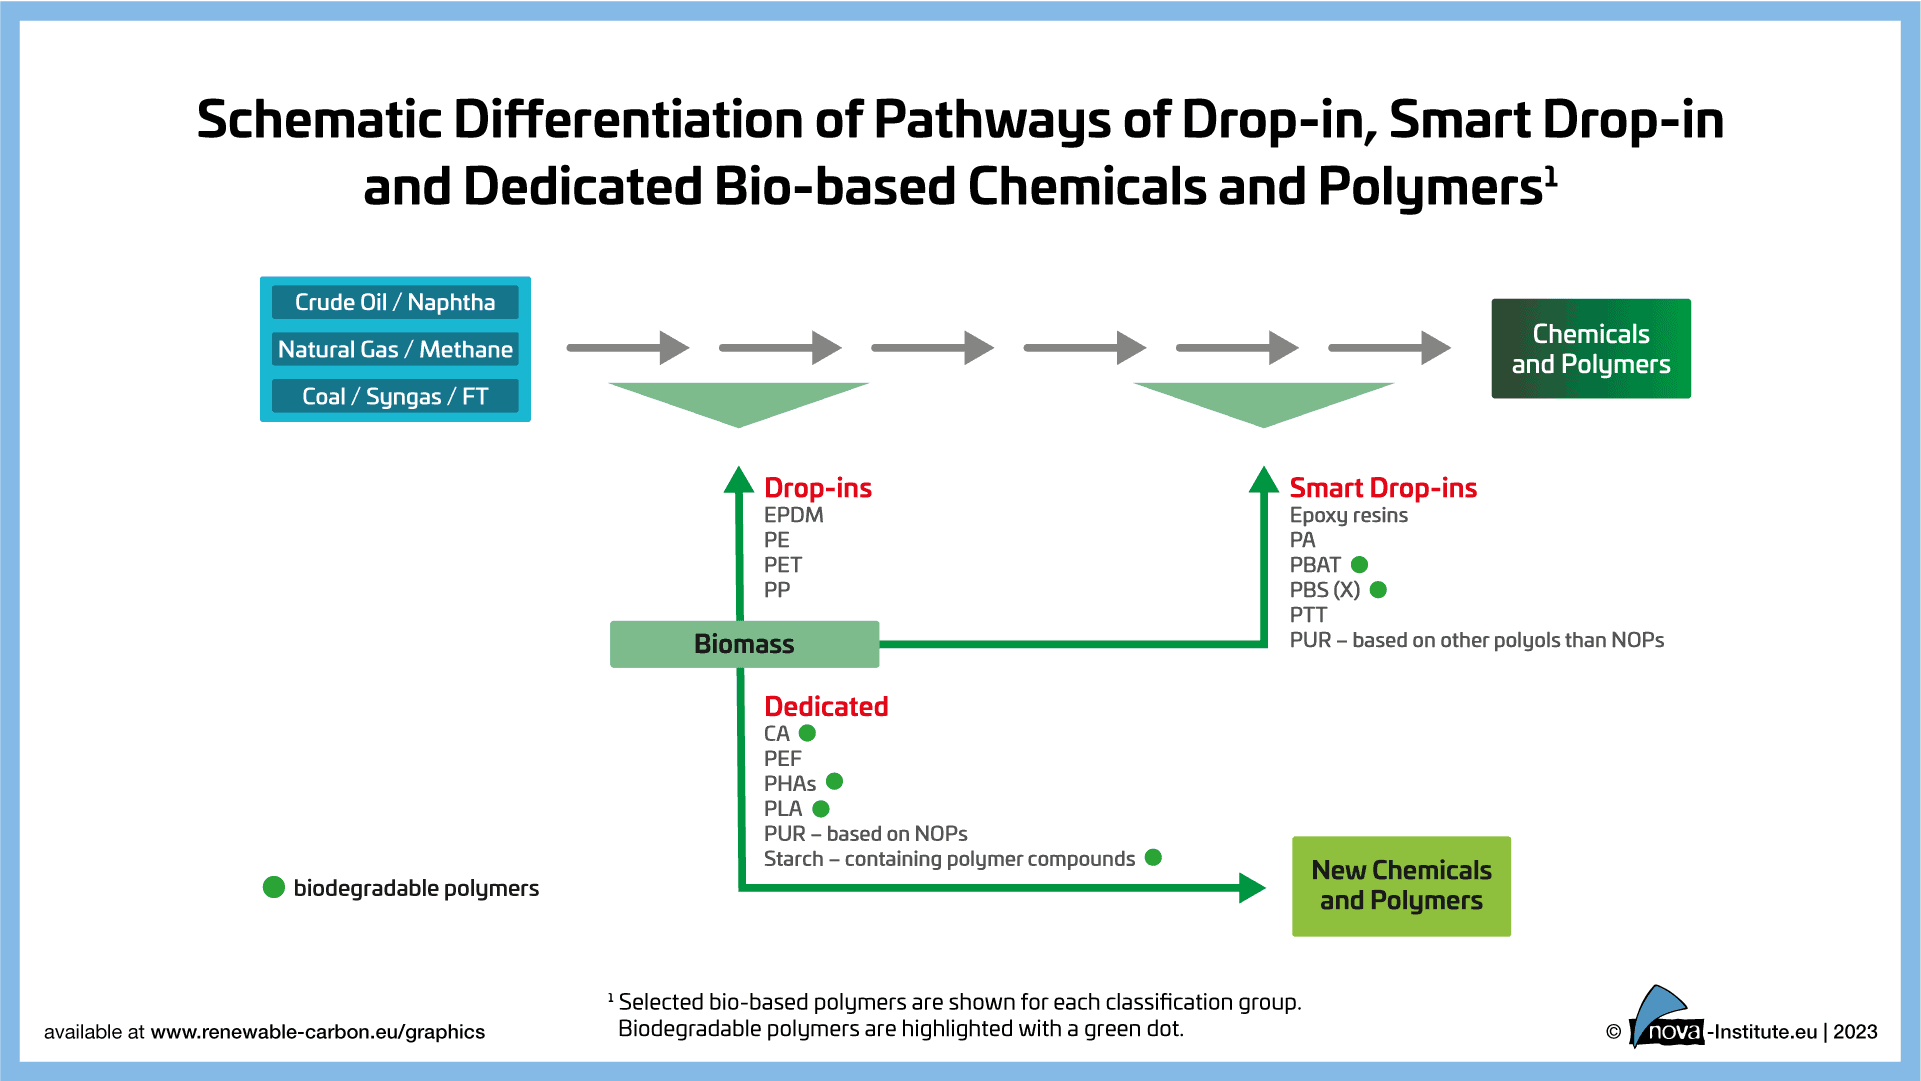
The new market and trend report “Bio-based Building Blocks and Polymers – Global Capacities, Production and Trends 2022–2027” by the international nova biopolymer expert group shows capacities and production data for 17 commercially available, bio‑based polymers in the year 2022 and a forecast to 2027. These polymers can be grouped in bio-based “drop-in”, “smart drop-in” and “dedicated” inputs within the chemical production chain. For each group, certain bio-based polymers are exemplarily shown (Figure 6). Additionally, biodegradable bio-based polymers are highlighted with a green dot. The different bio-based polymer groups are subject to different market dynamics.
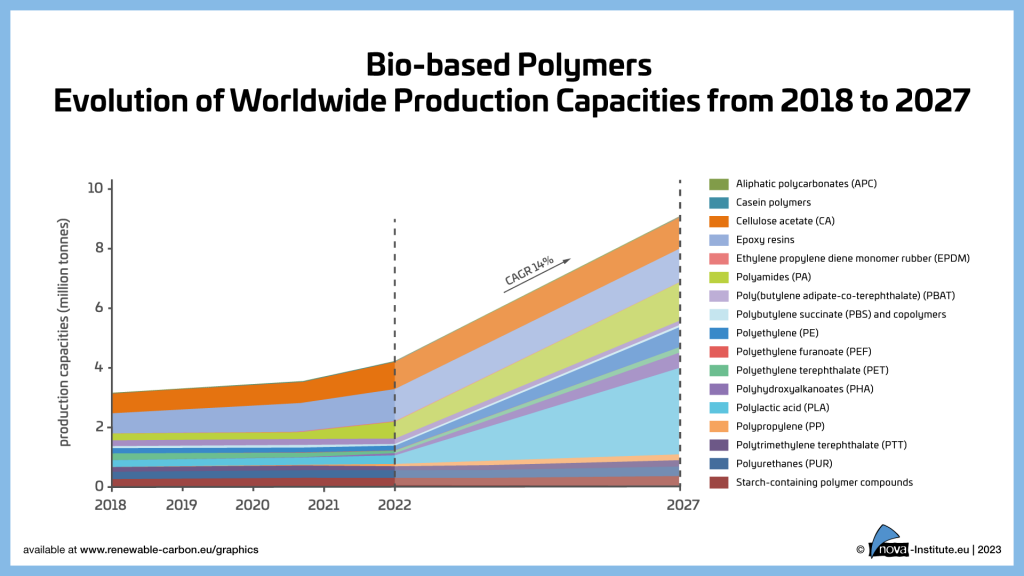
In 2022,the total installed capacity in 2022 was 4.9 million tonnes with an actual production of 4.5 million tonnes, which is 1 % of the total production volume of fossil‑based polymers. An increase to 9.3 million tonnes capacity in 2027 is expected, indicating an average compound annual growth rate (CAGR) of about 14%, significantly higher than the overall growth of polymers (3–4%). The following polymers show an even higher increase significantly above the average growth rate: PHA will grow by 45%, PLA by 39%, PA will continue to grow by 37% and PP by 34% until 2027. PE in Europe will increase by 18% until 2027, followed by a 15% increase in casein polymers (Figure 7).
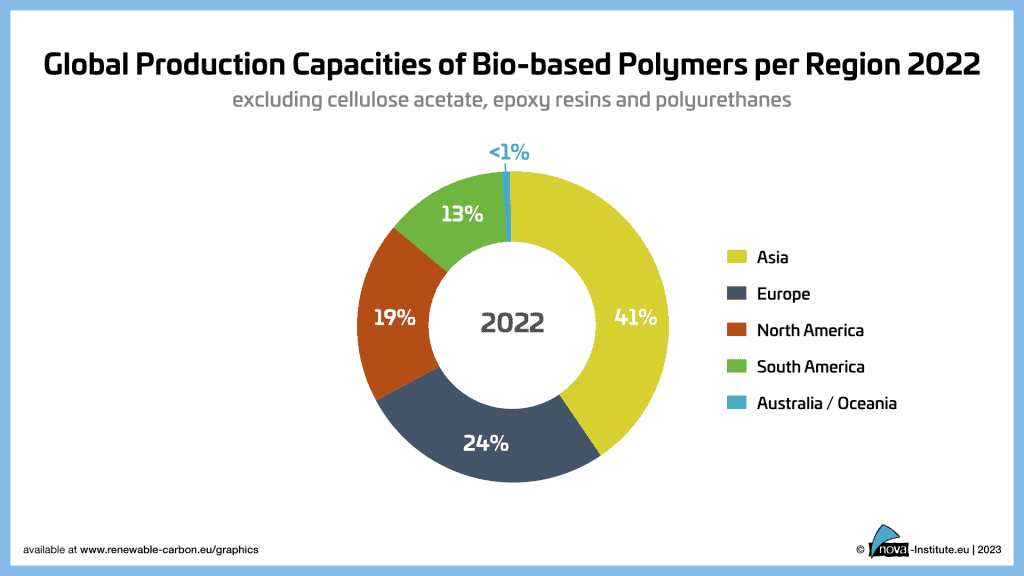
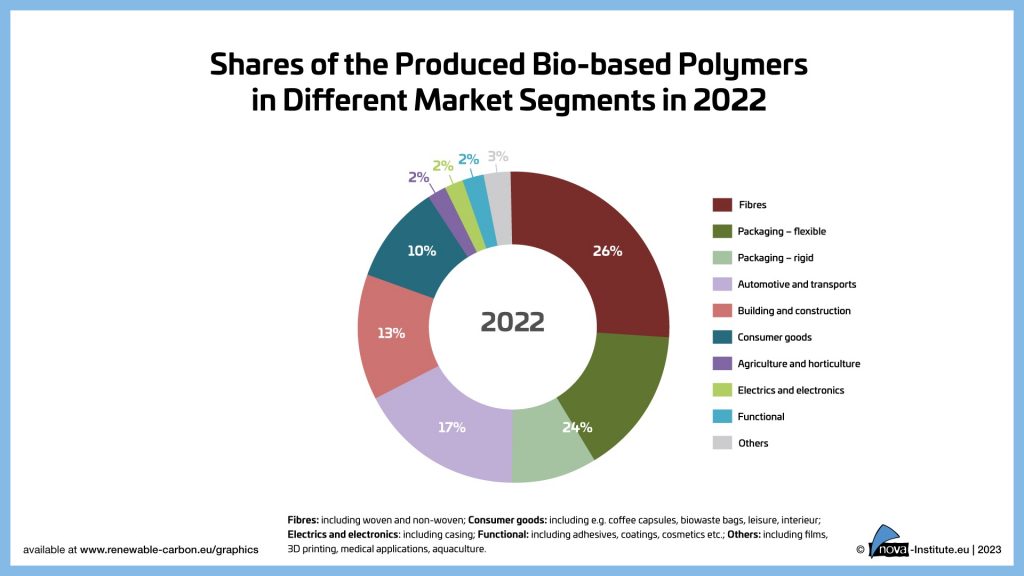
After Asia as leading region, which has installed the largest bio‑based production capacities worldwide with 41% in 2022, the largest capacities being for PLA and PA, Europe follows with 27%, mainly based on starch-containing polymer compounds, PE and PP. North America shares 19% with major installed capacities for PLA and PTT and South America 13%, mainly based on PE. The less then 1 % share of Australia/Oceania is based on starch-containing polymer compounds (Figure 8). Today, bio‑based polymers can be used in almost all market segments and applications, but the various applications per polymer can be very different. Figure 9 shows a summary of the applications for all bio‑based polymers covered in the report.
The major feedstock used for bio-based polymer production are sugars (29%), starch is used with 18%. These feedstocks are gained from high-yielding sugarcane and maize resulting in high area efficiency. Additionally, these yields are not only used for polymer production but also for animal feed, regarding the protein share, and thus only a part is allocated. Glycerol (27%) a by-product from biodiesel production represents a biomass without additional land use.
Several global brands are already expanding their feedstock portfolio to include, next to fossil-based, also sources of renewable carbon, CO2, recycling and especially biomass. This rethinking from the market point of view, especiallyin the use of biomass, will, and already did, increase the demand and supply of bio-based as well as biodegradable polymers. Today, renewable carbon from biomass, CO2 and recycling is making up 11% of the worldwide polymer market. Nevertheless, at the same time, there is a lack of support from policy in Europe, which still only promotes biofuels and bioenergy. In contrast, supportive regulations for bio-based chemicals and polymers can be found in Asia and especially in the US.
For 2022, the annually updated market report is featuring 16 selected bio-based building blocks and 17 commercially available bio-based polymers, comprehensive information on the capacity development from 2018 to 2027, as well as production data for the year 2021 and 2022 per bio-based polymer. Furthermore, the report includes analyses of market developments and producers per building block and polymer, so that readers can quickly gain an overview of developments that go far beyond capacity and production figures. As an additional bonus, the report provides a comprehensive expert view on “Mass Balance and Free Attribution (MBFA)” as well as on the “Packaging and Packaging Waste Regulation”. Finally, the deep insight into bio-based manufacturers, launched in 2018, has been extensively updated and now features 200 detailed company profiles – from start‑ups to multinational corporations.
The data published annually by European Bioplastics (www.european-bioplastics.org/market) are derived from this market report, but with a smaller selection of bio-based polymers.
Packaging 360 is a comprehensive knowledge sharing ecosystem for the Indian packaging industry. Our services include an online content platform to deliver news, insights and case studies; organising conferences seminars and customised training; Providing Bespoke Project Consulting, Market Research and Intelligence.


